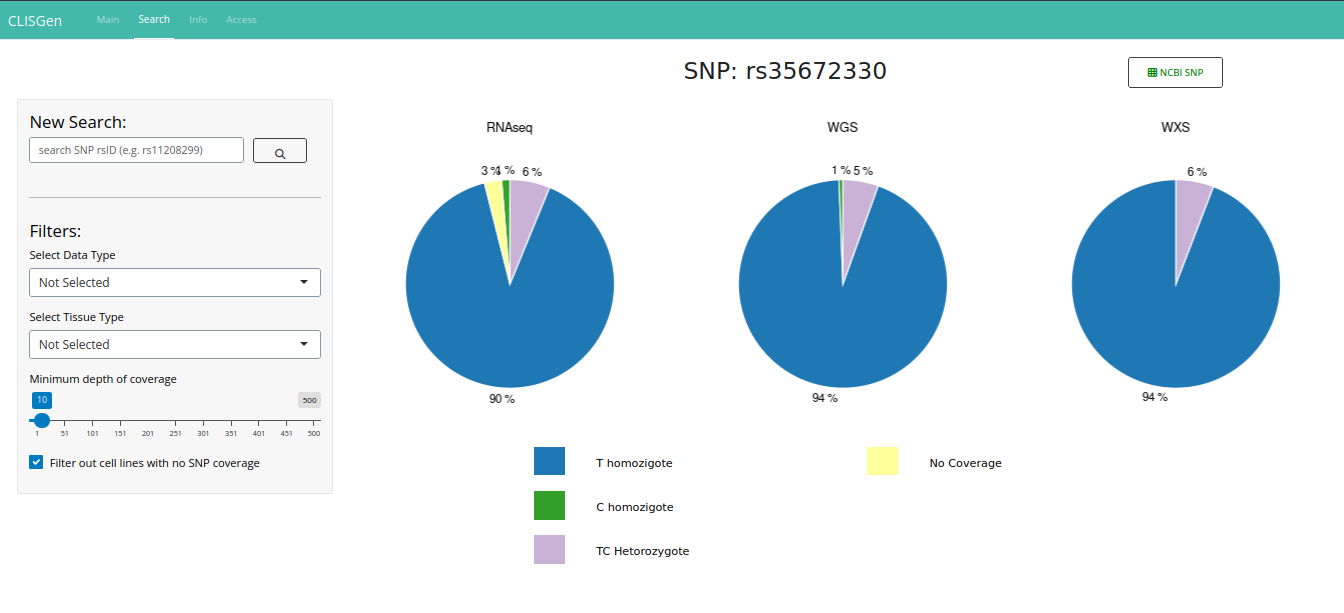
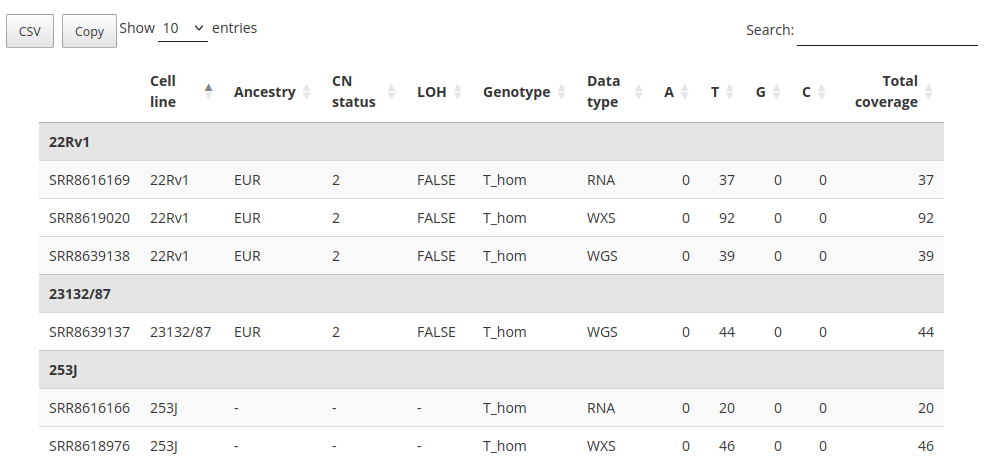
On the Search page, all data related to the queried SNP are displayed, including Pileup information, copy number details (when available), and associated metadata. The initial results view provides a comprehensive overview of genotype distributions across approximately 1,000 cell lines in the database. A default coverage filter is applied to ensure high-quality results, but you can modify or remove it as needed.
In the main section of the page, a series of pie charts illustrate the distribution of observed genotypes within each dataset. Beneath these visual summaries, a detailed data table lists information for each cell line with coverage at the queried SNP locus. This table serves as the most informative component of the interface, supporting in-depth data interpretation. For each sample, it reports the unique identifier, cell line name, ancestry group (if available), copy number (CN) status, loss of heterozygosity (LOH) annotation, genotype call, sequencing platform, and per-base read counts (A, T, C, G), along with the total coverage.